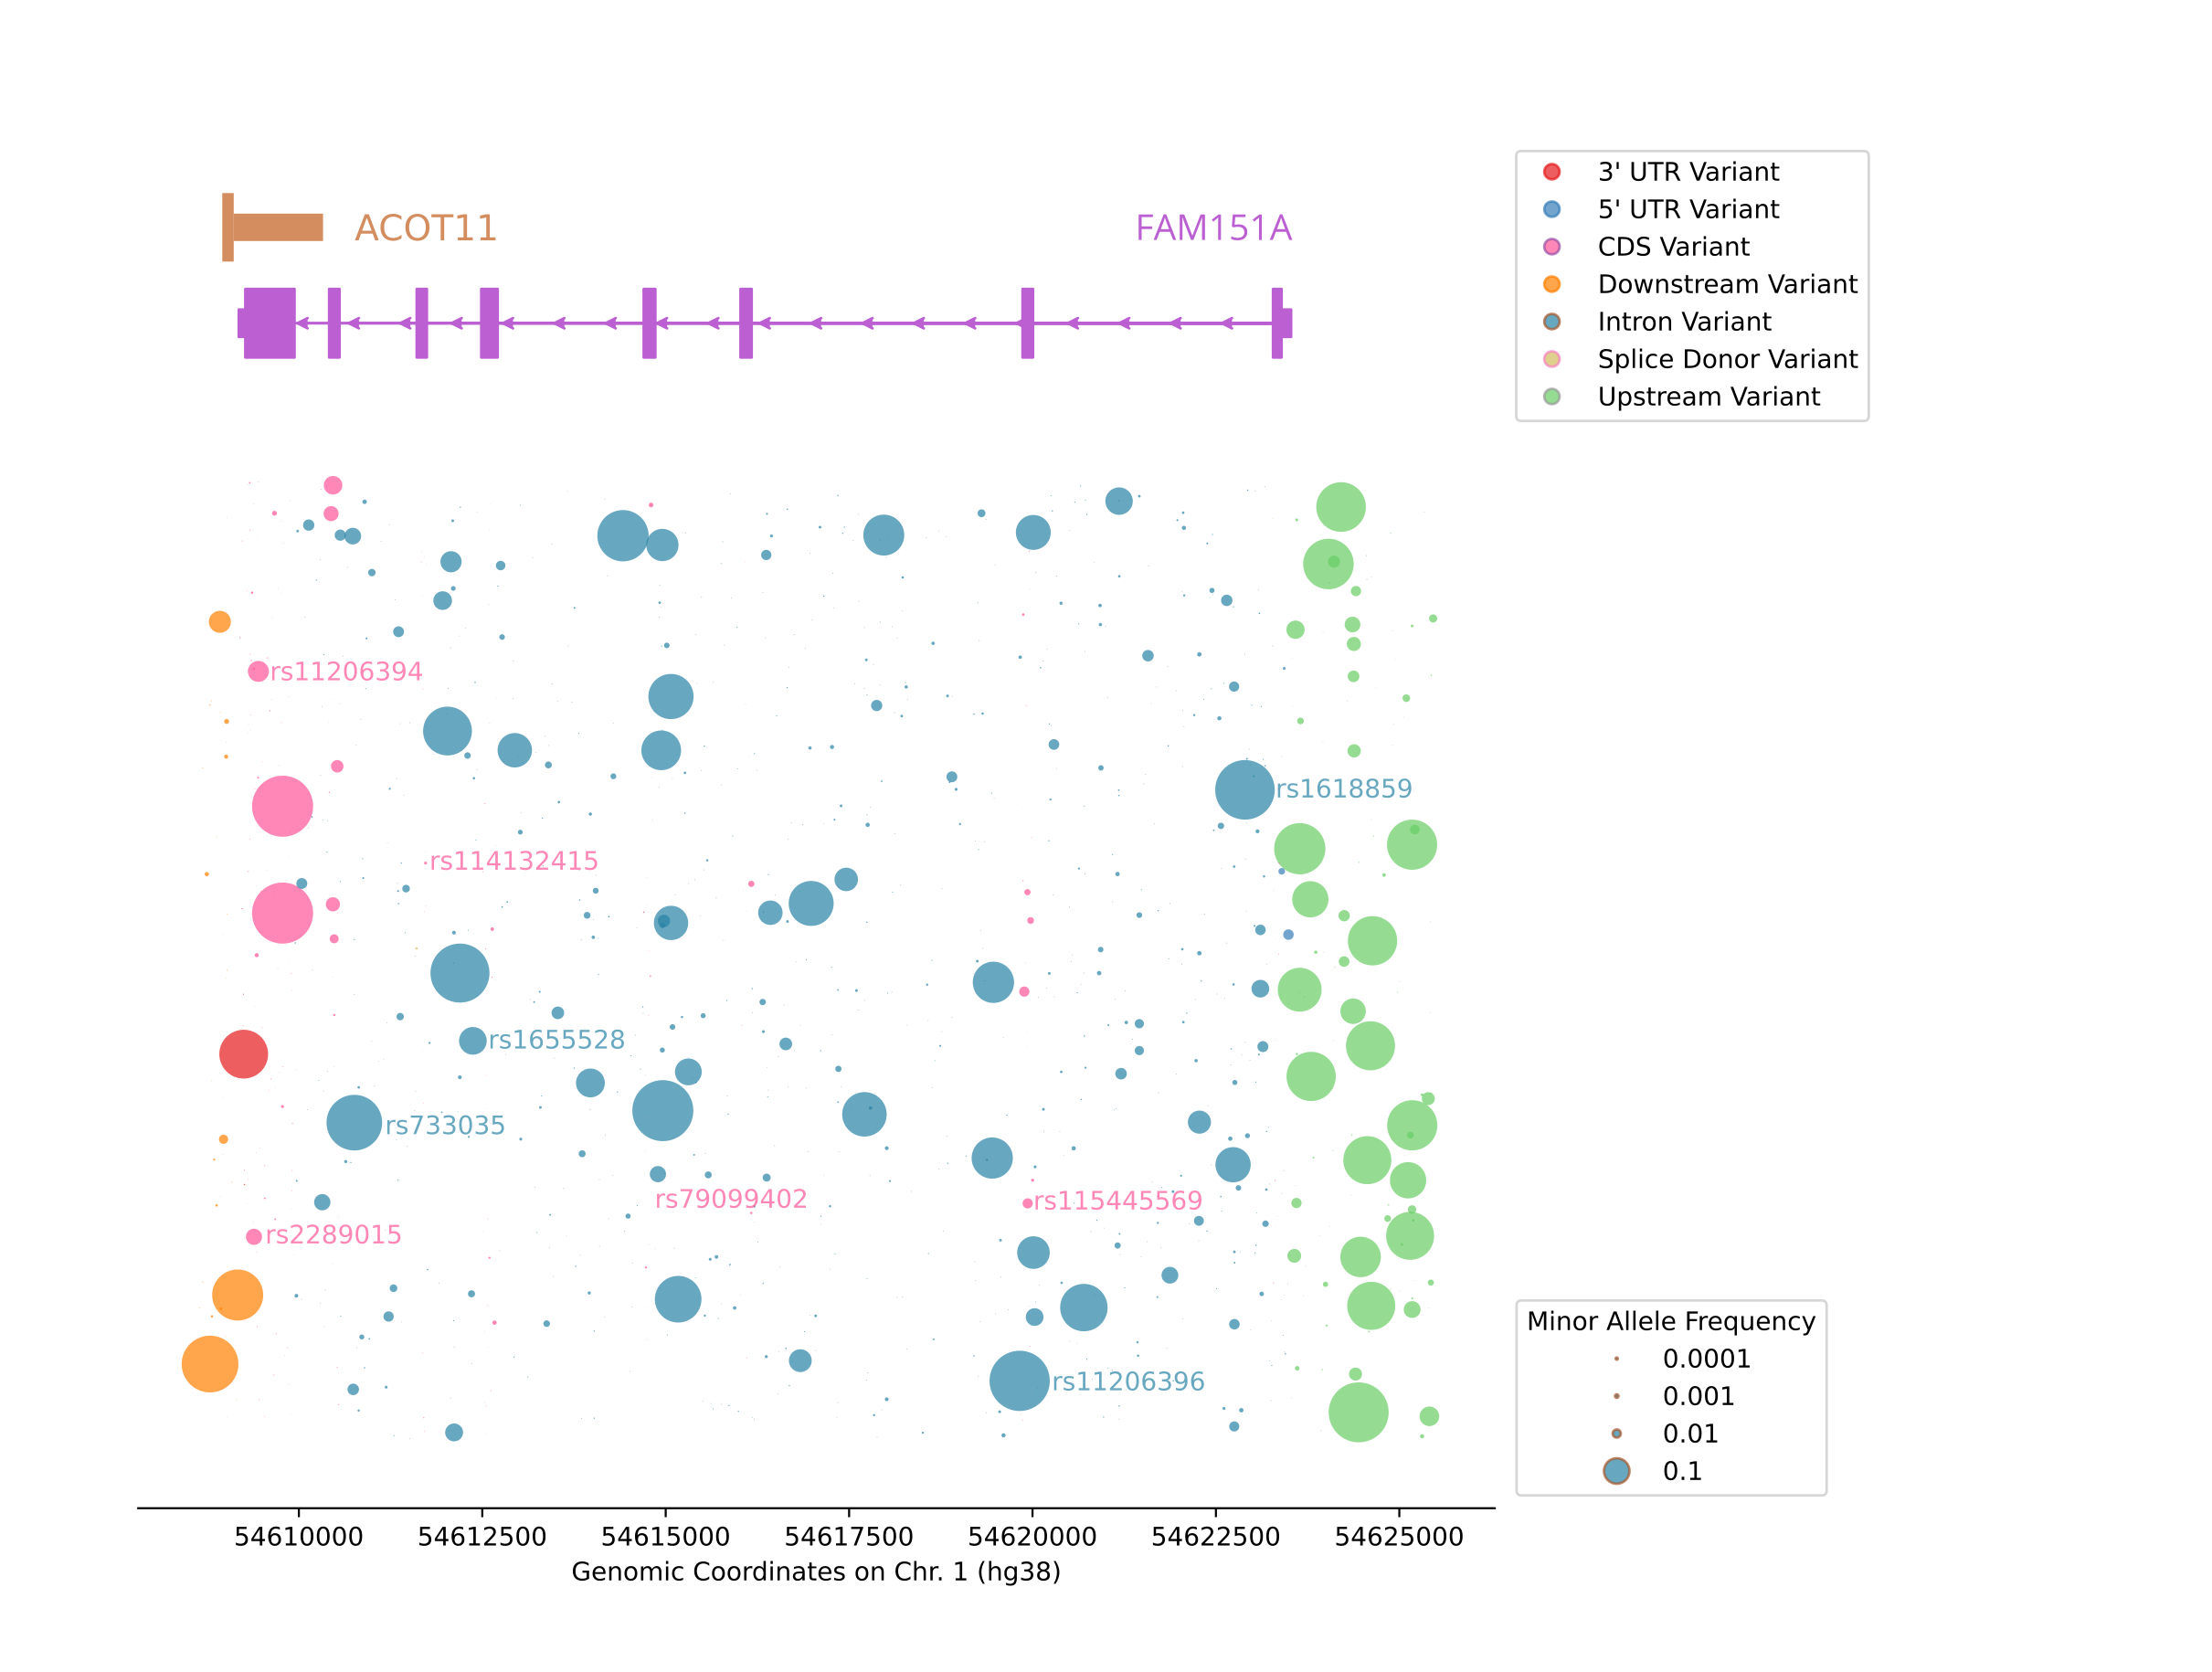
Diagram of SNPs on gene FAM151A. The size of each bubble corresponds to the minor allele frequency, while the color corresponds to the region of the gene to which the SNP corresponds. SNPs sequenced by 23andMe or having a PubMed citation are labeled.
