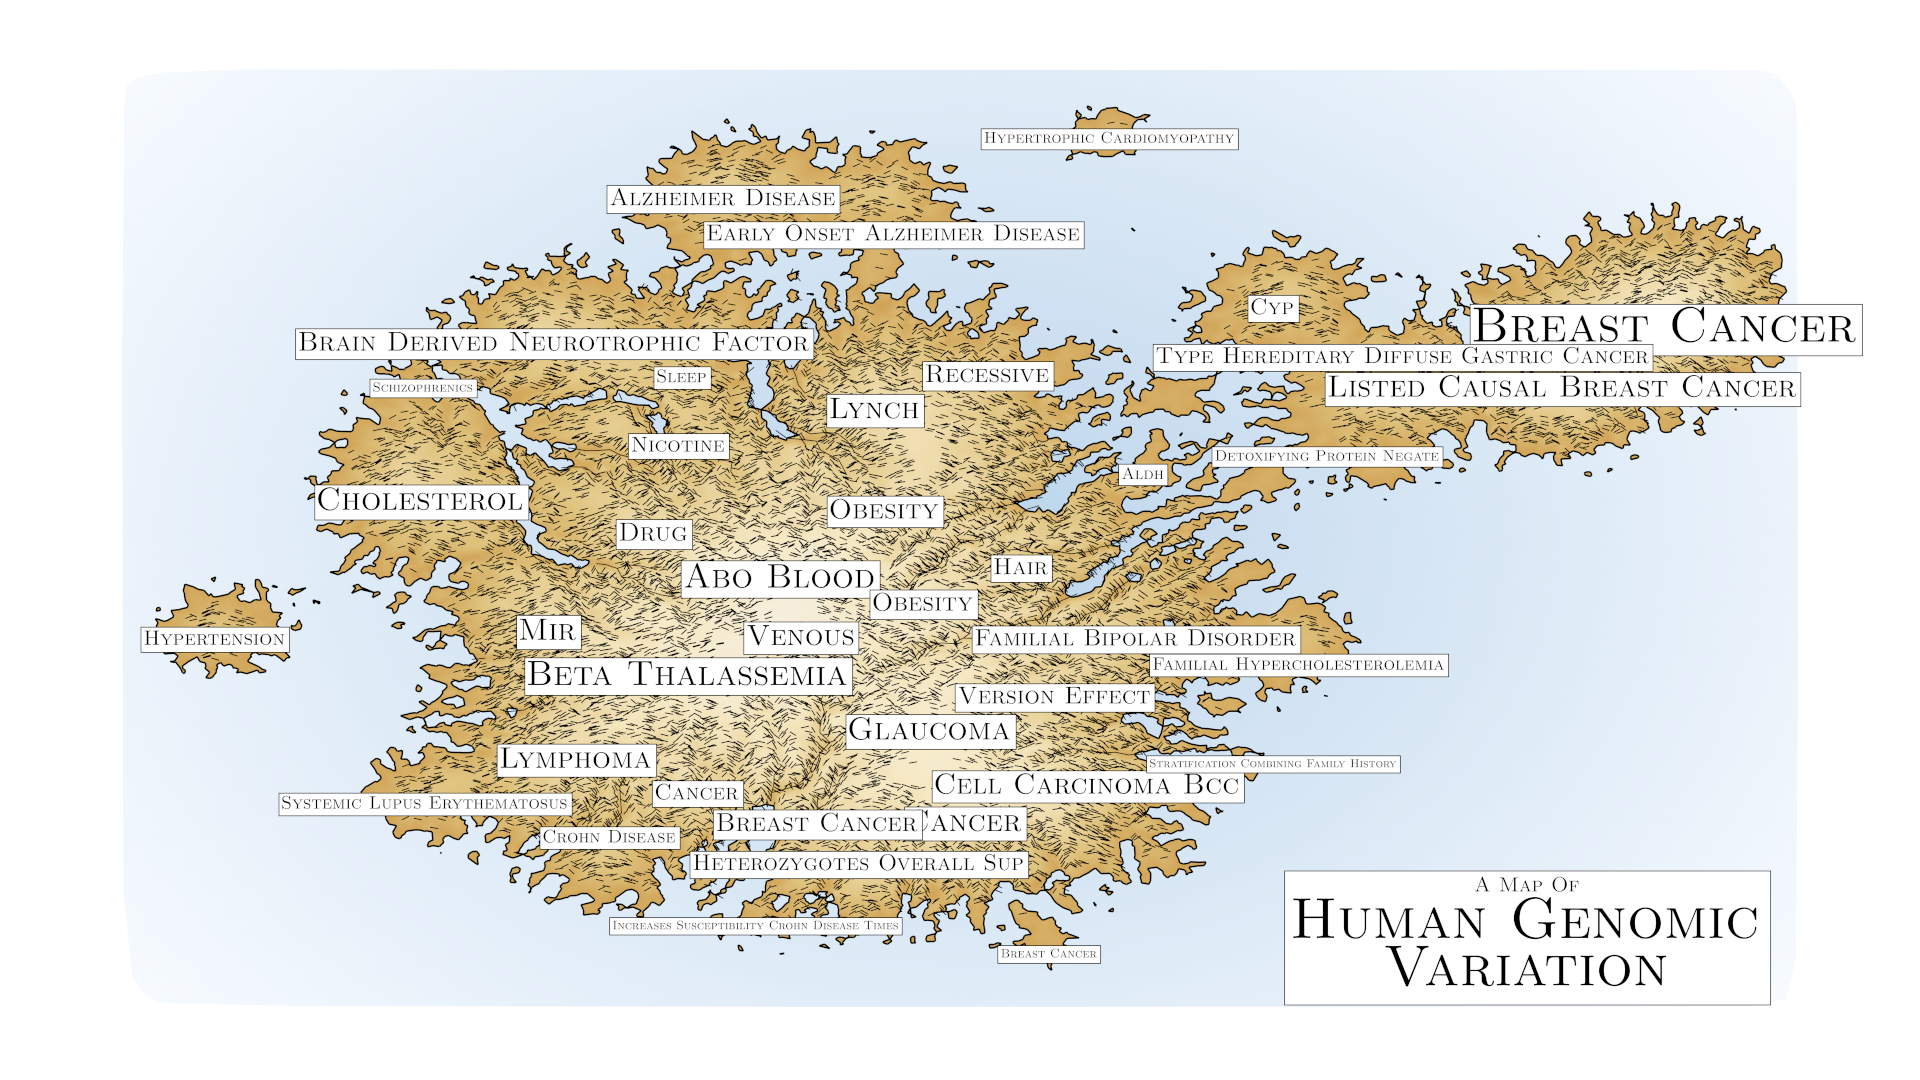
Map of SNPs genotyped by 23andMe in the SNPedia database. The horizontal and vertical positions are embeddings of the wiki pages into a low-dimensional space, and the height of the terrain roughly corresponds to the density of SNPs at that location.
To create the visualization, the text of the genotype page is run through a transformer-based embedder, and reduced using UMAP. These low-dimensionality embeddings are then clustered using k-means. For each cluster, the topic is determined by an overrepresentation test, namely, determining which phrases appear most frequently in that cluster compared to the rest. The label is placed at the center of the cluster, with the size corresponding to the size of the cluster.
To generate the terrain, I took inspiration from this tutorial.
